
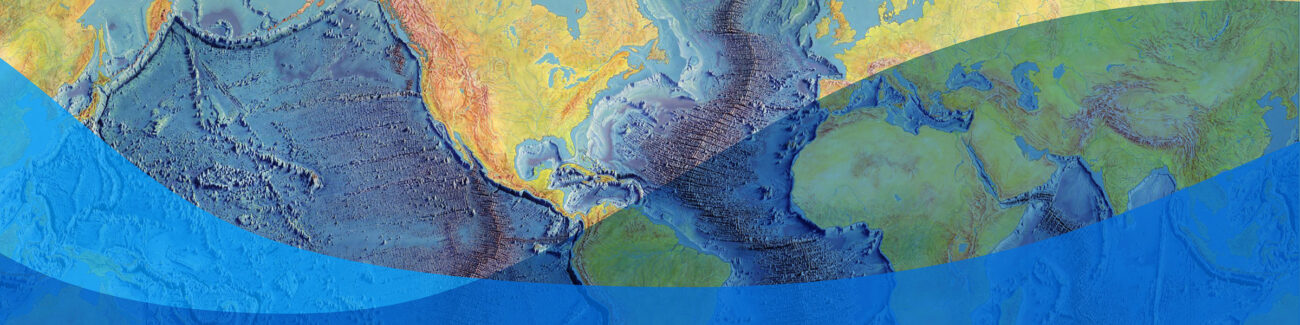
Though nearly three-quarters of Earth’s surface lies beneath the oceans, the seafloor remained largely unexamined until the mid-20th century. Published in 1977, the World Ocean Floor map presented a sweeping panorama that revealed the underwater landscape in remarkable detail. Today, it is regarded as a landmark in oceanography and scientific cartography.
This interactive explores key regions of the ocean floor and explains how decades of scientific observations were transformed into a vivid portrait of Earth’s hidden landscape. Along the way, you’ll learn how the map was created, meet the people behind it, and discover the marine geology and ocean science that continue to shape our understanding of the planet.
The Heezen–Tharp World Ocean Floor Map
Before the mid-20th century, much of the ocean floor was still a mystery. Though scientists had measured depths along ship routes and identified some major underwater features, the seafloor was still widely conceived of as a relatively flat, featureless plain.
Marie Tharp helped change that. Working with Columbia University geologist Bruce C. Heezen, Tharp transformed decades of ocean-depth measurements into a new visual language for the seafloor. Their maps revealed a vast underwater landscape: rift valleys, volcanic ridges, deep trenches and mountain chains stretching across entire ocean basins.
The culmination of their work was the World Ocean Floor map, published in 1977. The map combined scientific data, geological interpretation and dramatic artistry to show the ocean floor as a continuous global landscape. Through vertical exaggeration and painterly detail, it made an invisible world understandable to scientists and the public alike.
The map became one of the most influential scientific images of the 20th century, and it helped people see the ocean floor not as a static surface, but as part of a dynamic Earth.
Turning Data Into Landscapes: How Marie Tharp Mapped the Ocean
Marie Tharp came to Columbia’s Lamont Geological Observatory (now the Lamont-Doherty Earth Observatory, part of the Columbia Climate School) in 1948 with training in geology, mathematics and drafting. At Lamont, she began working with Bruce Heezen, forming a scientific partnership that would last for decades. Because women were generally not allowed on oceanographic research cruises at the time, Heezen collected data at sea while Tharp analyzed and mapped it back in the lab.

The raw material for Tharp’s maps came from echo sounding: instruments that measured ocean depth by sending sound pulses down to the seafloor and recording how long they took to return. These measurements arrived as long rolls of paper showing depth profiles along ship tracks. Tharp plotted the ship tracks, converted the soundings into cross sections, and used them to sketch the shape of the seafloor along each route.
But the data were incomplete. Research ships crossed the oceans along widely spaced paths, leaving large gaps between measured areas. Tharp used her geological training to interpret the patterns she saw, extending ridges, valleys, plains and fractures between the sounding lines.

This map view shows the approximate area detailed in the figure above after interpretation.
Tharp chose to present this work as physiographic diagrams—shaded, landscape-like views of underwater terrain. The style made the seafloor easier to understand than a technical contour map. It also offered a practical advantage during the Cold War: detailed bathymetric contour maps were restricted, while physiographic maps could communicate the shape of the ocean floor without publishing classified measurements.
The result was both scientific interpretation and visual storytelling: a way to turn scattered measurements into a coherent image of Earth’s hidden surface.
“I worked in the background for most of my career as a scientist, but I have absolutely no resentments,” Tharp said later in life. “I thought I was lucky to have a job that was so interesting.”
Science Meets Art: Heinrich Berann
While Tharp and Heezen supplied the scientific foundation of the World Ocean Floor map, Austrian painter and cartographer Heinrich C. Berann was essential in shaping its visual style.
“National Geographic had received a letter from a little girl in Austria who wrote, ‘I’ve been looking at your maps and my father can paint better than you can.’ Intrigued, National Geographic editors sent their chief topographer to Innsbruck, Austria, to meet the girl’s artist father, Heinrich Berann.” —Marie Tharp

Berann was internationally known for panoramic cartography: painted maps that combined geographic information with the drama, depth and atmosphere of landscape painting. Before the World Ocean Floor map, he had produced alpine panoramas, Olympic maps and other works for National Geographic; his collaboration with Tharp and Heezen began with ocean-basin maps before culminating in the 1977 global panorama.
For the World Ocean Floor map, Berann faced an unusual challenge: How do you make a hidden terrain visible, legible and beautiful, while still respecting the underlying science?
His solution was to treat the seafloor as a landscape. Using perspective, lighting, shadow, color and vertical exaggeration, Berann depicted steep mountain chains rising from the ocean depths, trenches descending into darkness, and ridges and valleys as interconnected systems. These techniques helped viewers understand complex bathymetry—the depths and shapes of underwater terrain—at a glance.
Berann’s technique ensured that the World Ocean Floor map balanced scientific accuracy with clarity, and his artistry helped make it one of the most memorable scientific visualizations of the twentieth century.
A Rift Through the Atlantic: A Discovery That Changed Geology
At the center of the Atlantic Ocean, the World Ocean Floor map shows a vast underwater mountain chain: the Mid-Atlantic Ridge. Running along its crest is one of Tharp’s most important discoveries: a narrow rift valley that revealed the seafloor was far more active than many scientists had imagined.
Tharp first recognized the rift while plotting echo-sounding profiles across the Atlantic in the 1950s. The profiles showed that the ridge was not simply a broad underwater mountain range—it was split by a long valley running down its center. This was a striking clue that the ocean floor might be pulling apart.

The evidence became even stronger when Tharp and Heezen compared their maps with earthquake data. Although earthquake locations were imprecise, Tharp later recalled that when they overlaid the datasets, the earthquake epicenters “lined up within the valley.” The rift was not just a landform; it was a zone of geologic activity.

The idea was controversial. The theory of continental drift was still widely doubted, and many scientists viewed the ocean basins as old and relatively stable. Tharp’s interpretation suggested something very different: that new oceanic crust could be forming along the ridge as the seafloor spread apart.
Reactions ranged from excitement to skepticism. After Heezen presented the expanding mid-ocean rift system at Princeton in 1957, geologist Harry Hess reportedly told him, “Young man, you have shaken the foundations of geology!”
Earth in Motion: Fracture Zones and Transform Faults
The Mid-Atlantic Ridge revealed where new ocean crust forms. But another pattern on the World Ocean Floor map showed how that crust moves.
Look closely at the Atlantic seafloor and you can see long, nearly straight lines cutting across the ocean basin. These are fracture zones, or scars in the ocean crust that extend outward from mid-ocean ridges. They mark places where sections of the ridge have been offset from one another as tectonic plates move.

The active parts of these breaks are called transform faults. Unlike spreading ridges, where plates move apart, transform faults are places where plates slide past one another. Earthquakes occur along these active faults, making them another important clue that the seafloor is not fixed but in motion.
Fracture zones are important because they preserve a record of plate movement over millions of years. As new crust forms at a ridge and moves away, the offset pattern remains written into the seafloor. On Tharp and Heezen’s maps, these long lineations helped show that ocean crust was not deforming randomly; it was moving in broad, rigid plates.
Subduction: How Ocean Crust Returns to Earth
Trenches are the deepest places in the ocean. They form where one tectonic plate bends downward and sinks beneath another, carrying old, dense oceanic crust back into Earth’s mantle in a process called subduction. Along the western edge of South America, the Peru–Chile Trench marks the place where the oceanic Nazca Plate is being forced beneath the South American Plate.

Subduction zones are among the most geologically active places on Earth. As one plate descends beneath another, it can generate powerful earthquakes. Water and other materials carried downward with the sinking plate help trigger melting in the mantle, feeding volcanoes at the surface. In some places, these volcanoes form mountain chains like the Andes. In others, they form curved island arcs, such as Japan or the Aleutian Islands.
Putting the Pieces Together: Plate Tectonics
By the late 1960s, the features shown on the World Ocean Floor map were beginning to fit together into a new understanding of Earth.
The planet’s outer shell, or lithosphere, is divided into large moving plates. These plates do not drift randomly; they interact along boundaries that are visible across the seafloor: ridges, rift valleys, fracture zones and trenches.
At mid-ocean ridges, plates move apart and new oceanic crust forms. Along transform faults, plates slide past one another, offsetting ridge segments and leaving long fracture zones across the seafloor. At trenches, old oceanic crust sinks back into Earth’s interior through subduction. Volcanoes and earthquakes mark many of these active boundaries.
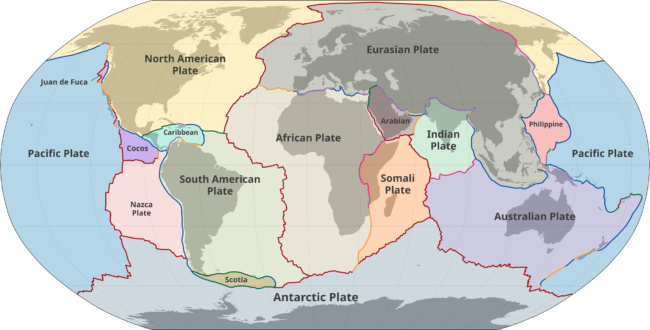
Seen separately, these features might seem like isolated landforms. Seen together, they reveal a dynamic global system.
That is part of what made the World Ocean Floor map so powerful: it helped reveal that Earth’s surface is not fixed. It is constantly being created, broken, moved and recycled.
Plate tectonics became the unifying theory of modern Earth science. It explains why oceans open and close, why continents move, why mountain ranges rise, why earthquakes cluster in certain regions and why volcanoes form where they do.
Ocean Mapping Today
Today, scientists map the seafloor with tools Tharp could only have imagined. Ships equipped with multibeam sonar send out sound pulses, measuring depth across wide swaths of ocean instead of along a single track. Autonomous underwater vehicles can survey difficult or remote areas in far greater detail. Satellites can detect subtle variations in sea-surface height caused by gravity, helping scientists infer the shape of large underwater features.
Even with these advances, it is estimated that only about 28% of the world’s ocean floor has been mapped to modern standards. The Seabed 2030 project aims to change that by bringing governments, research institutions, industry and mariners together to create a complete map of the ocean floor by the end of this decade. Better seafloor maps support marine science, hazard assessment, navigation, habitat protection, climate research and our understanding of Earth’s geologic history.
Tharp worked with sparse sounding tracks, scientific insight and a gift for seeing patterns in incomplete data. Modern ocean mappers have more powerful tools, but they are still pursuing the same basic goal: to make the hidden surface of our planet visible.



Tinggalkan Balasan